
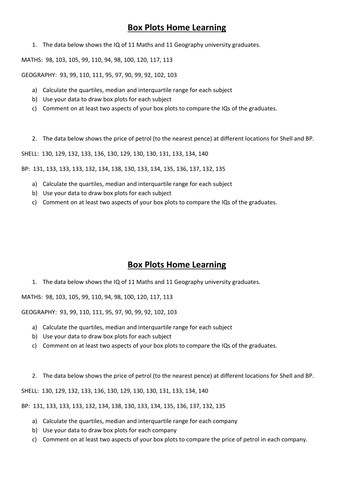
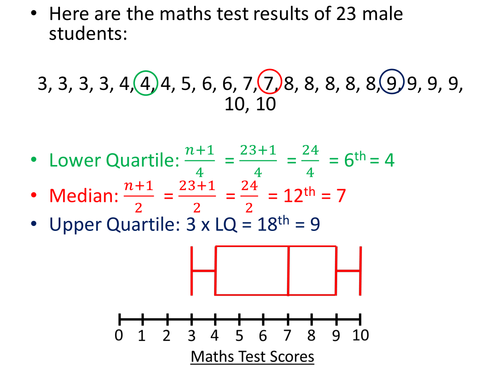
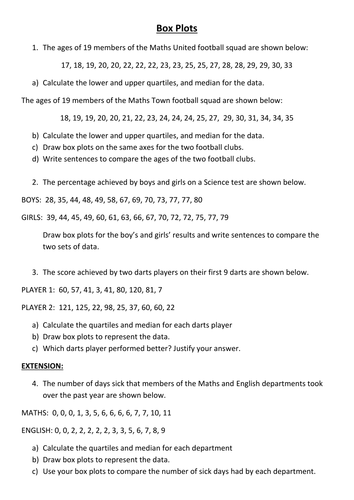
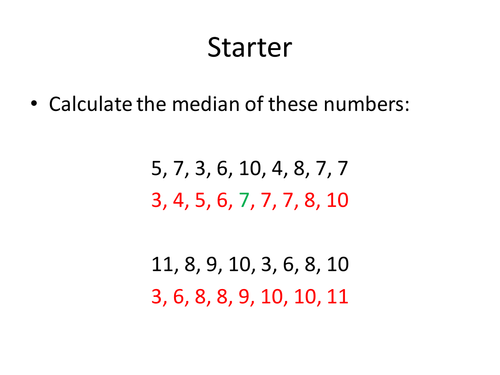

PPT looking at how to calculate the quartiles, then how to use these to draw box plots and finally how to compare two box plots.
Also a couple of worksheets to allow students to get some independant practice, plus the data I collected from my year 9s that I got them to draw box plots from to compare my two year 9 classes.
Something went wrong, please try again later.
Very well done. Thanks for sharing
Excellent Resource, thank you for sharing
Is it me going mad or are there lots of errors in this?<br /> Denominator in Maths Town part of Q1 (22?) etc
Good enough
Very well done. Thanks for sharing
Report this resourceto let us know if it violates our terms and conditions.
Our customer service team will review your report and will be in touch.
£0.00